It has been about a year since I added a post to this blog. The reason for this is that I have been working on a new and improved method of sharing educational ideas, tools, tech tips, and resources. I have created a new site at Educationalresource.org. I will be updating and posting to this site from now on. Please come and explore the new site an let me know what you think.
Wednesday, December 31, 2014
Monday, March 24, 2014
Smartboard Smart Ink: Google Chrome now works with Smart Ink.
About a month ago, some of you may have been in the same boat as I, which is where the Smart Ink toolbar quit working with the latest version of Google Chrome. This was a great loss, but easily overcome by just using a different browser. You don't have to worry about it now. I just installed the latest update for Smart Ink and this problem seems to be fixed.
Smart Notebook: Smart Ink toolbar now hides automatically
One of my most popular posts has been about the ability to turn off the Smart Ink, a product of the Smart Notebook and Smartboard system. I really, really, really like Smart Ink and really don't understand why so many people have an issue with the toolbar being visible on their open windows. I use Smart Ink all the time during my math class to write on top of PDF files, tests, quizzes and the like. Well the cool thing is that Smart Tech has just added a new feature to the Smart Ink Settings. You can now click a simple check box that will hide the toolbar until you use one of the Smartboard markers to draw on an open window. In three clicks the set up will be complete after you have installed the latest updates.
Here is how:
1. Install the latest Smartboard/Notebook updates. Open up your Notebook software and click the "Help" option from the menu bar. Choose the "Check for Updates and Activation" option.


Make sure you click the "Apply" button down on the bottom right of the Smart Ink Settings window.
This should help get rid of the toolbar until you need it.
Here is how:
1. Install the latest Smartboard/Notebook updates. Open up your Notebook software and click the "Help" option from the menu bar. Choose the "Check for Updates and Activation" option.
2. Click the "Check Now" button at the bottom right. This will check to make sure you have the latest updates. If you don't, the "whited out" buttons will appear. Click the "update" buttons for both your Smart Notebook and Smart Ink.
3. Now click the "Smart Ink" floating tool bar and choose the "Settings" option.
4. Once in settings all you have to do is click the "check box" that says "Hide Smart Ink toolbars until you draw over a window."
Make sure you click the "Apply" button down on the bottom right of the Smart Ink Settings window.
This should help get rid of the toolbar until you need it.
Wednesday, January 8, 2014
Google Drive: Quick Tip.. How do I find out how many files do I have.
Sometimes you want to find out how many files you actually have in Google Drive. Mostly what you will find is just how much space your files are taking up which you can find that by just looking at the bottom left side of your Google Drive.


If you want to see how many actual files you have follow these tutorial steps.
1. Make sure you are in the Drive section where all your documents and folders are located and not actually in a folder, even those these instructions will work the same if you want to find out how many files you have in a single folder. Once you are there, click on check box at the very top next to the word "Title." This will select all of your folders and files.
2. Now click on the "More" button.
3. Click on the "Download" option.
4. You should now see numbers next to the different document types. This should be easier than just counting them individually.
Monday, January 6, 2014
Create a music score with noteflight.com
At last I have found a free music score creator. I would have been willing to pay also, but wasn't sure whether or not the software was worth it. Noteflight.com allows you to create and learn the software with full ability to create your own score. They will let you create up to 10 scores with 15 instruments and still allow you to embed and share your scores online. You can always upgrade and get many more options, but for now I can explore the software. I truly have been looking for a means of creating my own music, not that I have the talent yet to do so, but it is something on my bucket list. If you are a music teacher and you have advanced students then this software might be great for them. If you are currently using a full membership of Noteflight, please comment below on how it is benefiting your music classroom.
Here is a quick tutorial one the benefits of Noteflight.
1. Go to www.noteflight.com and create a profile/account. Once you have an account and are logged in, click the "New Score" button.

2. Decide what type of music score you are wanting to create. You can either do a private or a shared score with the free version.

3. Give your song a title and who the composer and lyricist are. In this case that would be me.

5. The "Staff" tab give you the ability to play with your time and key signatures. You can also add voice here.

6. Now just start adding the parts of the music by hovering your mouse over the empty measure. Click on the type of music symbols that you will need to create your music. Just left click on a measure, moving your mouse up and down to place your notes in the right section.

7. You can also create your music in HTML 5 which might be easier for you. I personally prefer HTML 5 over Flash. Give both ways a try. To get to the HTML 5 music score creator, just go to "View" and select the "Switch to HTML5 Editor" option. The layout looks a little cleaner, but the options are all the same.

8. Below are some images of the HTML 5 version.


Use the comment section below to let us know how your experience with Noteflight goes.
Here is a quick tutorial one the benefits of Noteflight.
1. Go to www.noteflight.com and create a profile/account. Once you have an account and are logged in, click the "New Score" button.
2. Decide what type of music score you are wanting to create. You can either do a private or a shared score with the free version.
3. Give your song a title and who the composer and lyricist are. In this case that would be me.
4. Down at the very bottom you can change the tempo of you music.
5. The "Staff" tab give you the ability to play with your time and key signatures. You can also add voice here.
6. Now just start adding the parts of the music by hovering your mouse over the empty measure. Click on the type of music symbols that you will need to create your music. Just left click on a measure, moving your mouse up and down to place your notes in the right section.
7. You can also create your music in HTML 5 which might be easier for you. I personally prefer HTML 5 over Flash. Give both ways a try. To get to the HTML 5 music score creator, just go to "View" and select the "Switch to HTML5 Editor" option. The layout looks a little cleaner, but the options are all the same.
8. Below are some images of the HTML 5 version.
Use the comment section below to let us know how your experience with Noteflight goes.
Thursday, January 2, 2014
Create graphs and charts using this Online Chart Tool.
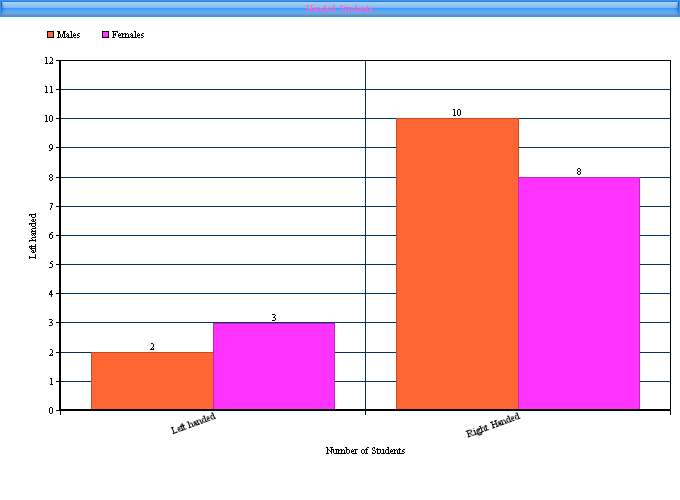
The online ChartTool is another useful tool to use when trying to teach students about the different types of graphs and charts. You can use this tool to create bar, line, area, and pie charts. You can use it to graph X and Y coordinates, create scatter and bubble charts. All you need to do is have your students is gather data and then plug it in to the different fields and in seconds you have an easy explain data chart. In the tutorial below I will demonstrate just the bar chart, but just like all software the best way to understand its uses is to "play" with it yourself.
1. Go to http://www.onlinecharttool.com. After you create a user name and are logged in just click the "Design your chart" button.

2. Pick the type of chart you want to create.

3. Now click the "Add Data" tab.

4. Give your chart a title, describe your X and Y Axis. The nice thing about the ChartTool is that you can also import CSV files if you are taking data from an existing source.

5. Decide how many items and groups you are going to need. Give each group a color and label. Give each item a name and a value. That value is what your students should have already researched. Add your data set labels and their values.

6. Don't forget to "Play" with the title options off to the right. Then click the "Next" button.

7. On the "Labels and Fonts" tab you can now play with how you want your data labels to be. Below you can also change the fonts.

8. Now decided how big you would like your graph to be. You should also be seeing a chart preview. You may go back and fourth between tabs to change the fonts and colors as you want.

9. On the "Save and Share" tab you can now save your chart in many different formats. You can post it to Twitter, Facebook or Google Plus. You can also email yourself the chart. The way I do it, is have my students paste the image into a Google Doc and share it with me. If you click the "Save Chart image online" option the ChartTool will give you an embed code to add to your website or blog.


1. Go to http://www.onlinecharttool.com. After you create a user name and are logged in just click the "Design your chart" button.

2. Pick the type of chart you want to create.

3. Now click the "Add Data" tab.
4. Give your chart a title, describe your X and Y Axis. The nice thing about the ChartTool is that you can also import CSV files if you are taking data from an existing source.

5. Decide how many items and groups you are going to need. Give each group a color and label. Give each item a name and a value. That value is what your students should have already researched. Add your data set labels and their values.

6. Don't forget to "Play" with the title options off to the right. Then click the "Next" button.
7. On the "Labels and Fonts" tab you can now play with how you want your data labels to be. Below you can also change the fonts.

8. Now decided how big you would like your graph to be. You should also be seeing a chart preview. You may go back and fourth between tabs to change the fonts and colors as you want.

9. On the "Save and Share" tab you can now save your chart in many different formats. You can post it to Twitter, Facebook or Google Plus. You can also email yourself the chart. The way I do it, is have my students paste the image into a Google Doc and share it with me. If you click the "Save Chart image online" option the ChartTool will give you an embed code to add to your website or blog.

Wednesday, January 1, 2014
The Eyeball tool
I remember working with my dad when we were building the house ( I was about 12) during which time I heard on more than one occasion that I had crooked eyeballs. After playing the Eyeball game, I feel confident that I probably have straighter eyeballs than he does. I am thinking about challenging him to a game to see who really has the crooked eyeballs.
Here is a quick view as to what the Eyeball game is all about.
1. First this game can be used during down times, where you might have some "free time" with your students. You know when you have an early release, or 20 minute classes because of an assembly.
2. Go to http://woodgears.ca/eyeball/
3. Each section of the game give you parts of a geometric shape. Your goal is to complete the shape as closes as you can, by dragging the "Square" into the correct position, in this case to make a parallelogram.

5. Your scores will appear to the right. You need to play 3 rounds so that your scores can be averaged.

6. One of the really cool things I like about this game is that you now get to see how you did compared to the last 10,000 games. As you can see I don't have the worst eyeballs, but I don't have the best either. I might need to play a few more times.

If you know any other great games like this make a note of it in the comments section below.
Here is a quick view as to what the Eyeball game is all about.
1. First this game can be used during down times, where you might have some "free time" with your students. You know when you have an early release, or 20 minute classes because of an assembly.
2. Go to http://woodgears.ca/eyeball/
3. Each section of the game give you parts of a geometric shape. Your goal is to complete the shape as closes as you can, by dragging the "Square" into the correct position, in this case to make a parallelogram.

4. After you let go of your left mouse button, a "green" set of line segments will appear to show you how close you were to getting the shape correct. It scores you down at the bottom. Click next to go to the next shape.

5. Your scores will appear to the right. You need to play 3 rounds so that your scores can be averaged.

6. One of the really cool things I like about this game is that you now get to see how you did compared to the last 10,000 games. As you can see I don't have the worst eyeballs, but I don't have the best either. I might need to play a few more times.

If you know any other great games like this make a note of it in the comments section below.
Subscribe to:
Posts (Atom)